A-ROW proof of concept
validating animated stimuli for use in cross-cultural research
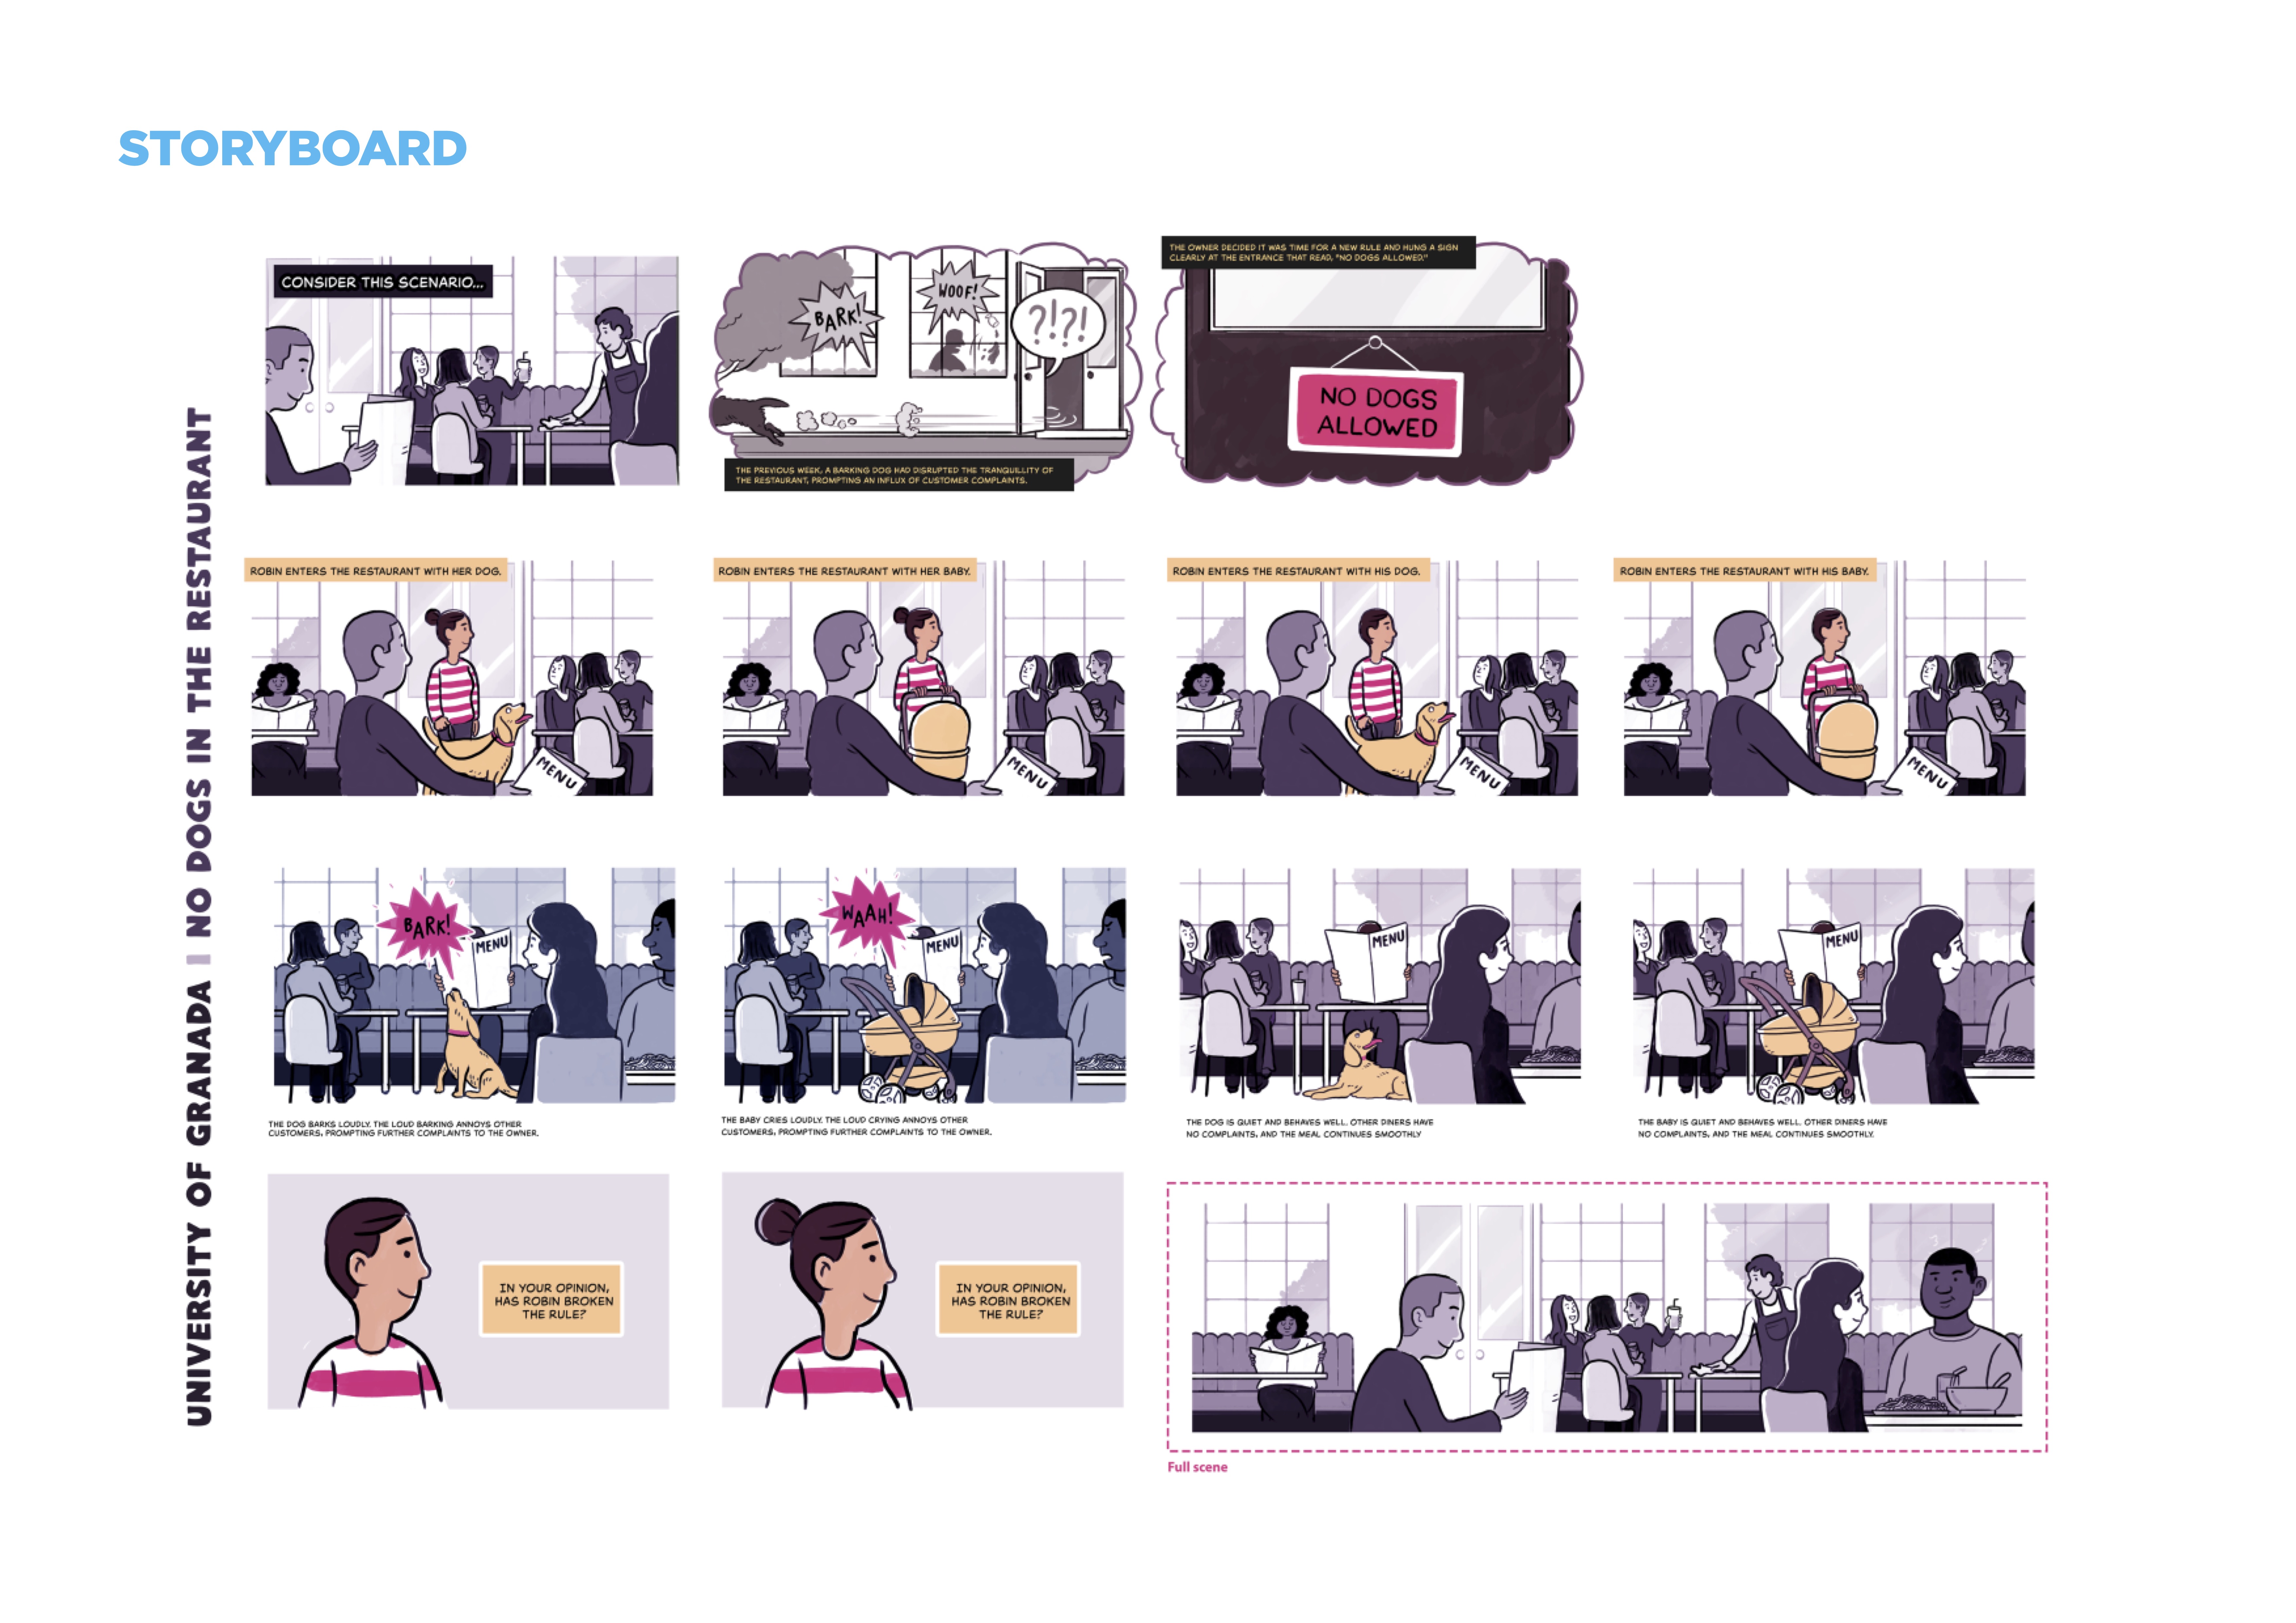
The A-ROW (Animated Rules of the World) project investigates judgments of rule violation. As in previous work, we consider a rule as composed by its literal meaning (i.e., text) and its underlying spirit (or purpose). In this proof-of-concept, the key question is how the mode of administration influences response behavior, user experience, completion rates and the like. In collaboration with the team at We are Cognitive, we have developed an animated stimulus set for one rule (i.e., “No Dogs Allowed”). The storyboard in Figure 1 illustrates the key elements of the sequence: how the rule originated, a protagonist’s behavior and the consequences of their behavior.

In our proof-of-concept studies, participants are assigned to either the animation-based or a text-based analogue in a between-subjects design. We will not only focus on participants’ violation judgments, but also on their subjective perception of the experiment, thus evaluating differences in experimental design from a qualitative standpoint.
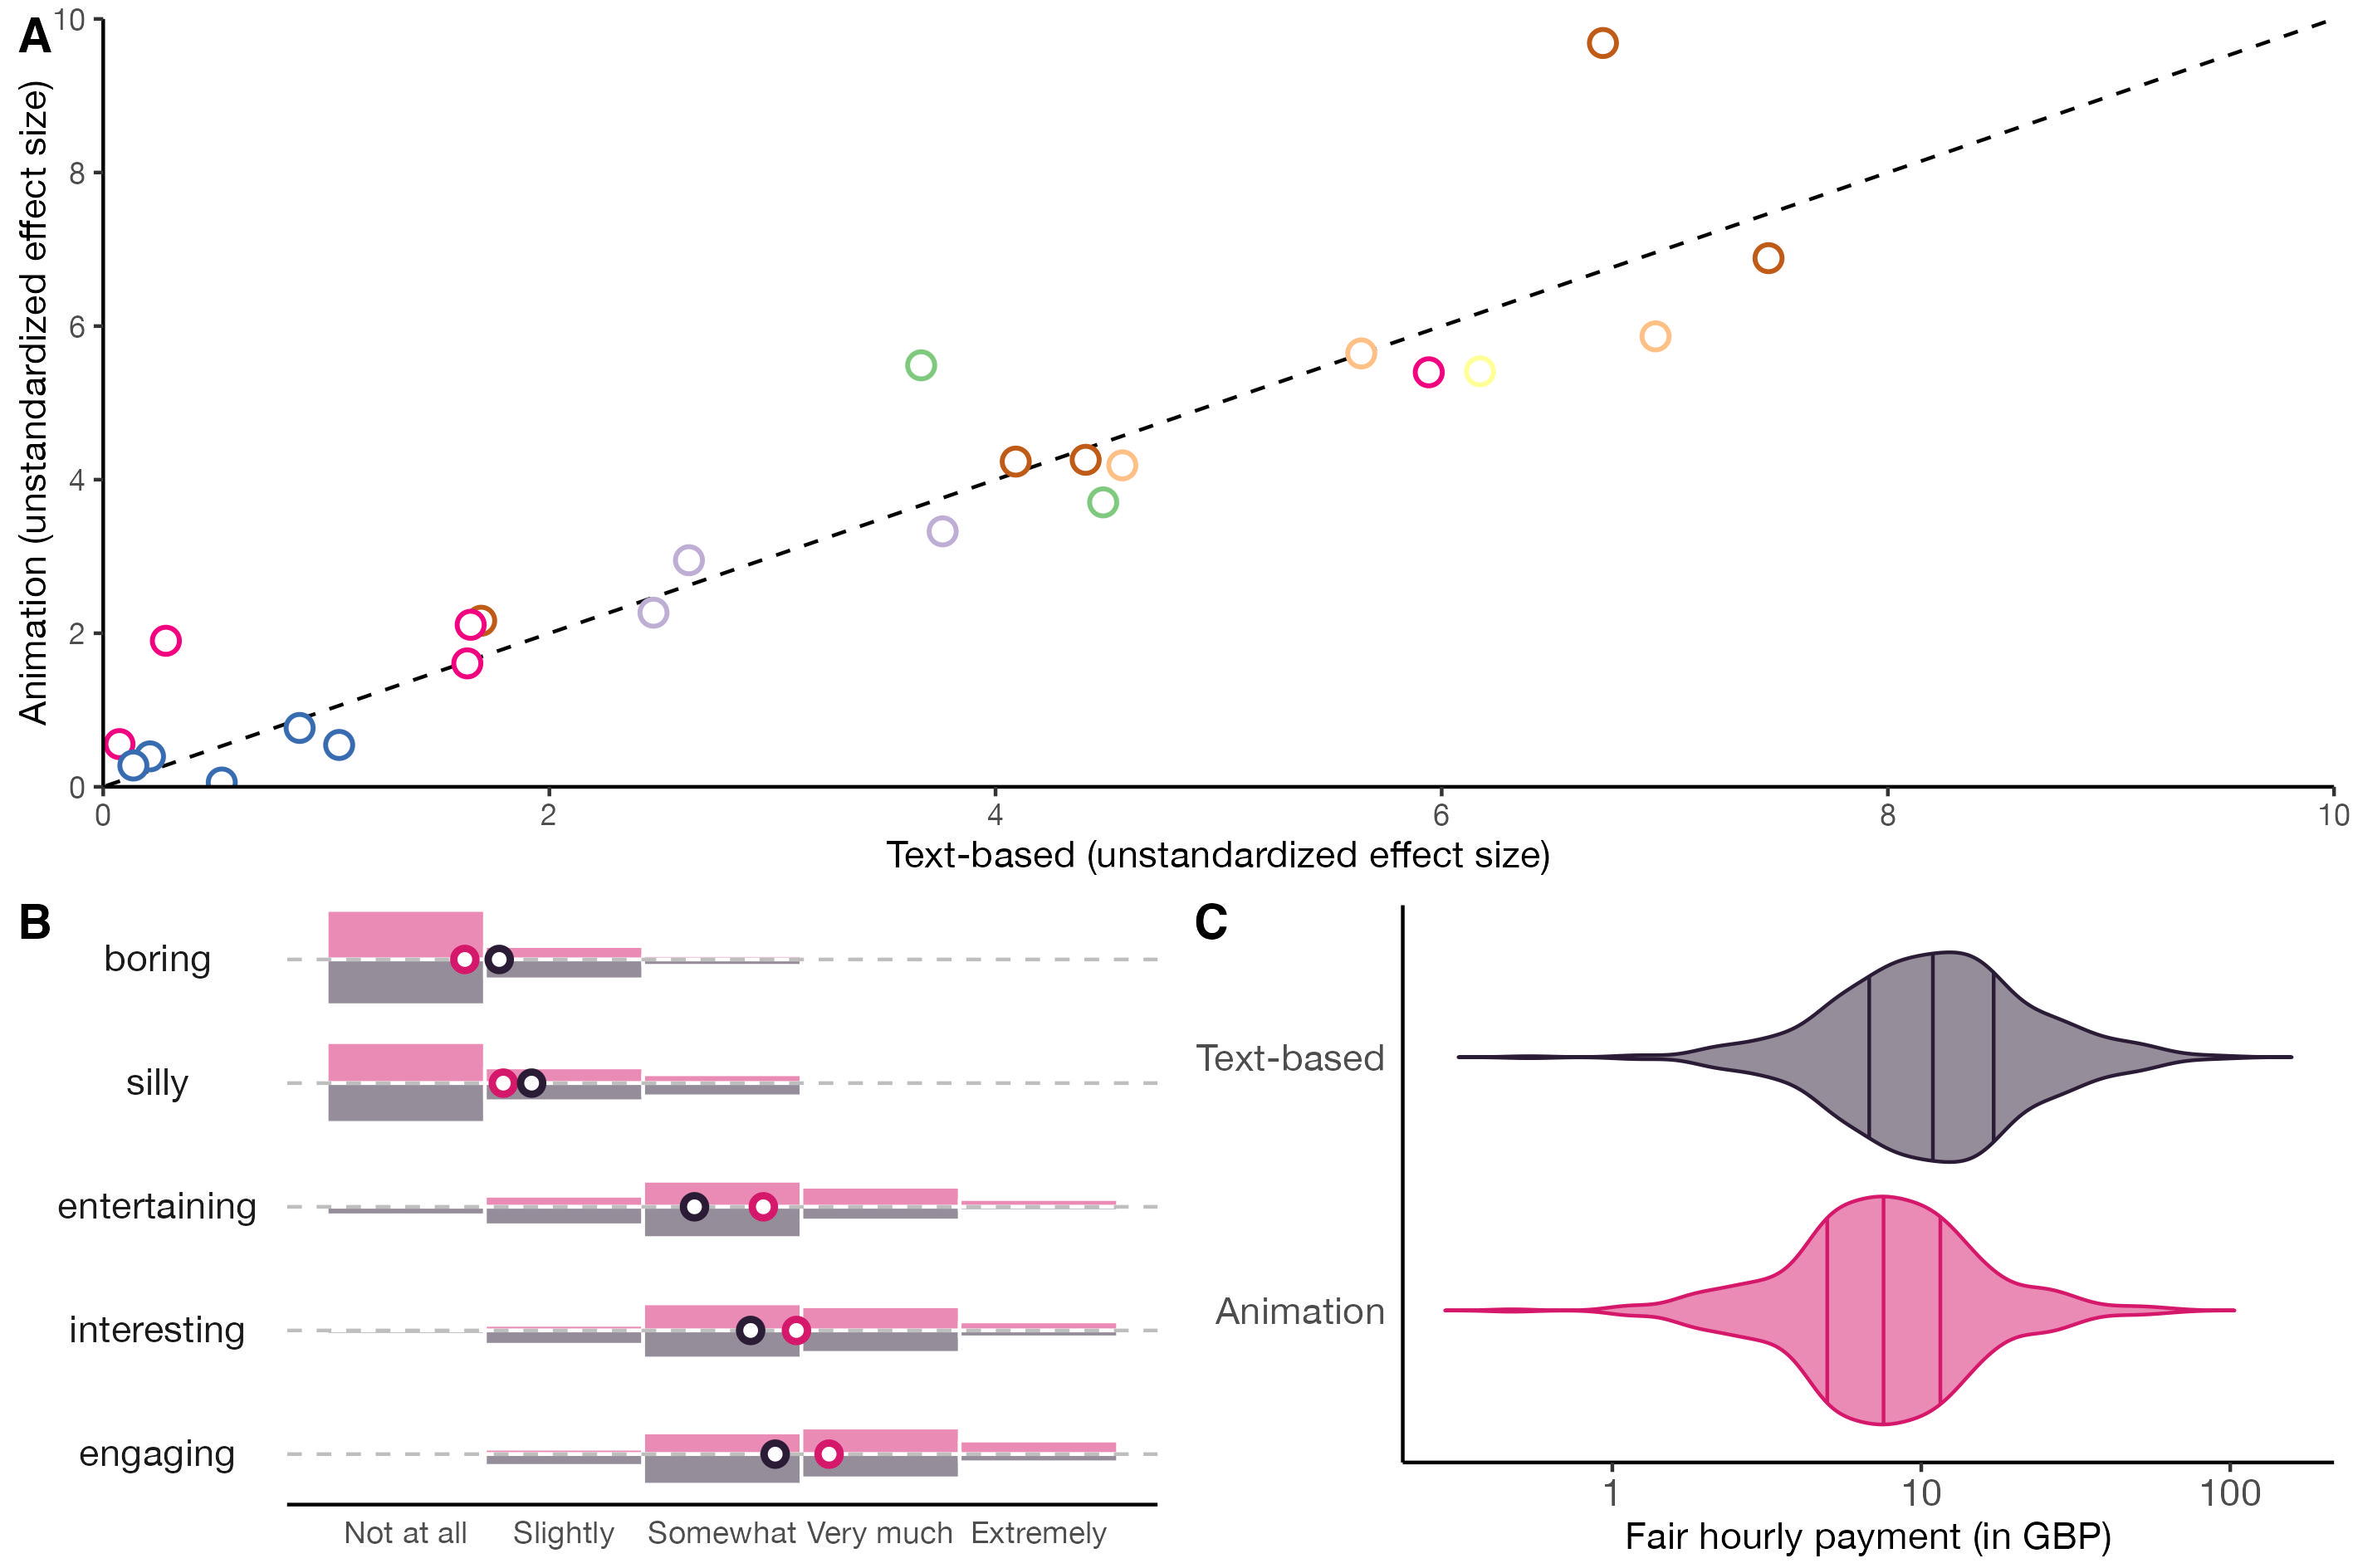
Thus far, the results indicate that the magnitude of the effect sizes are strongly correlated across animation-based and text-based modes of delivery (see Figure 2A), r(22) = .93, p < .001, providing initial validation of the method against the existing literature.
Follow-up questions about participants’ experience indicate multiple preferences for the animation-based delivery: The animations are less boring (Cohen’s d = -0.28), less silly (Cohen’s d = 0.19), more entertaining (Cohen’s d = 0.29), more interesting (Cohen’s d = 0.29) and more engaging (Cohen’s d = 0.42) than text-based vignettes (Figure 2B), all ps < .001. Figure 2C also shows a lower expected payment among participants in the animation condition (Mdn = £7.62 per hour) than in the text-based vignette (Mdn = £11.00 per hour) condition (rank-sum test: W = 100615, p < .001).

A live version of the study is available here. You are welcome to take part and share the study link with your friends!